A Taiwan-stock quant platform, from research to orders.
Data updates, screening, backtesting, optimisation, machine learning and the post-close order list all run on one platform. Claude helps design and review strategies but sees only in-sample data; out-of-sample validation is always done by code.
- built-in strategies, 22 backed by a paper
- 28
- built-in strategies, 22 backed by a paper
- factors with IC and quantile analysis
- 20
- factors with IC and quantile analysis
- API routes
- 75
- API routes
- weekday run: signals computed and sent
- 18:30
- weekday run: signals computed and sent
01
Problems
No subscription
A self-hosted research environment with no monthly fee, where the data and code stay under my control.
No retail broker API
Cathay Securities offers no retail API, so trading is semi-automated: compute the list, send a notification, place the orders by hand.
Backtest bias
Backtests easily use data that was not yet published (look-ahead bias) or overfit through excessive tuning.
Yahoo throttles cloud IPs
Yahoo rate-limits cloud servers, so adjusted prices are computed in-house from FinMind raw data.
Learning while building
As a newcomer to quant, I needed an AI tutor that can query data, run backtests and explain the results.
02
Architecture
A Next.js front end on the public domain proxies /api to FastAPI on the private network, with DuckDB for storage. Background jobs and the scheduler run inside the API process, so DuckDB is never locked across processes.
← Swipe to see the whole flow →
Tech stack
- Front end
- Next.jsReactTailwind CSSTanStack Querylightweight-chartsECharts
- Back end & data
- PythonFastAPIDuckDBpandasNumPy
- Quant & ML
- OptunaLightGBM
- AI
- Claude CodeMCPAnthropic API
- Deployment
- DockerZeaburDiscord
03
Key features
Stock research
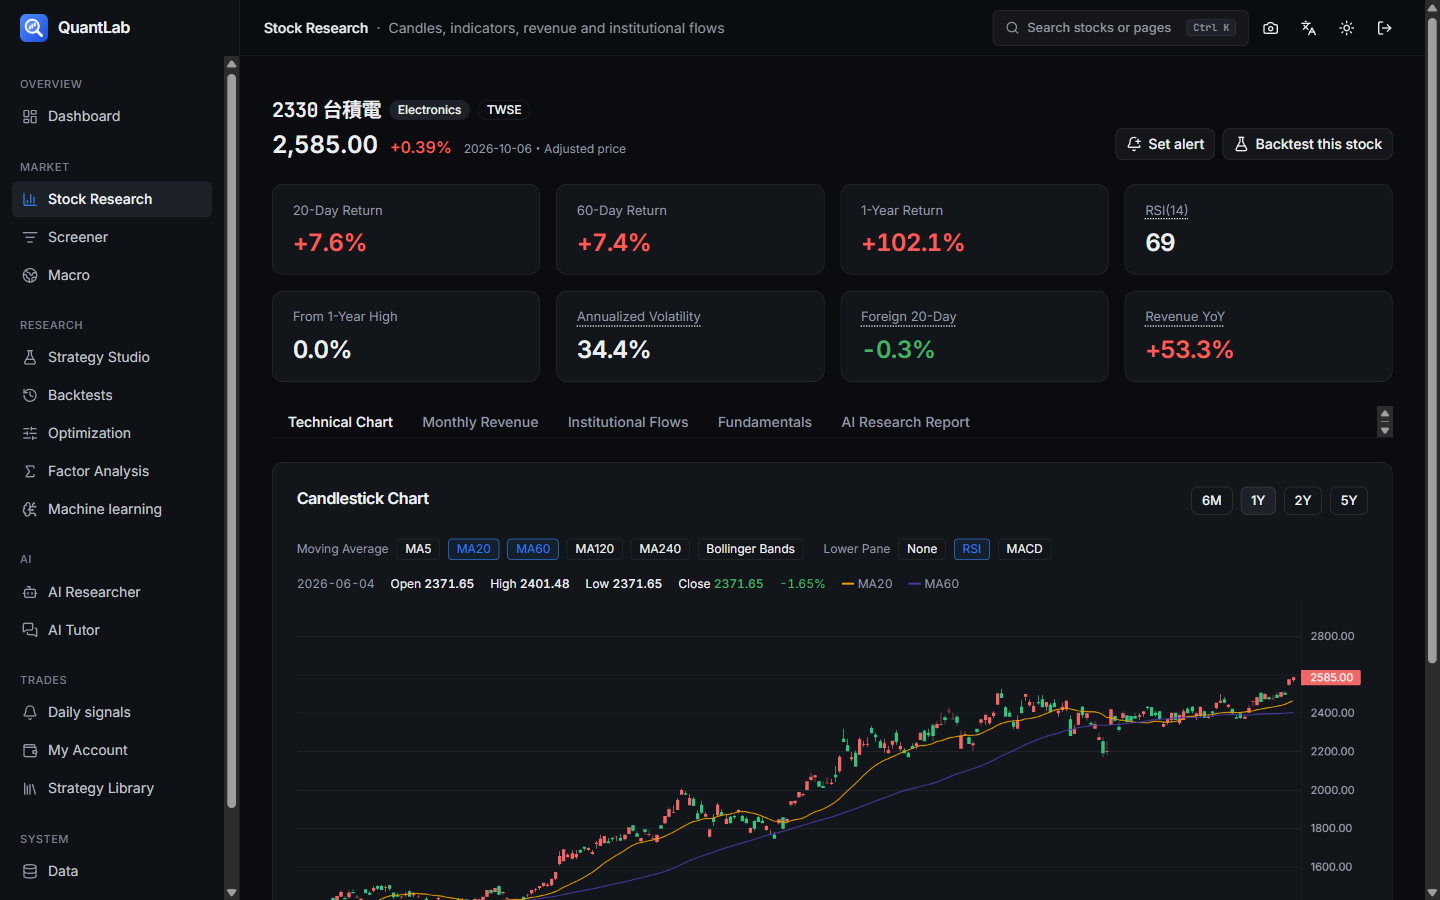
Candles and indicators, monthly revenue, institutional flows, P/E bands and an AI report.
Screener
Rule-based screening over the universe or all listed stocks, one click to a strategy or alert.
Strategy studio
28 built-in strategies and a visual rule builder, or describe a strategy and let Claude draft it.
Backtest report
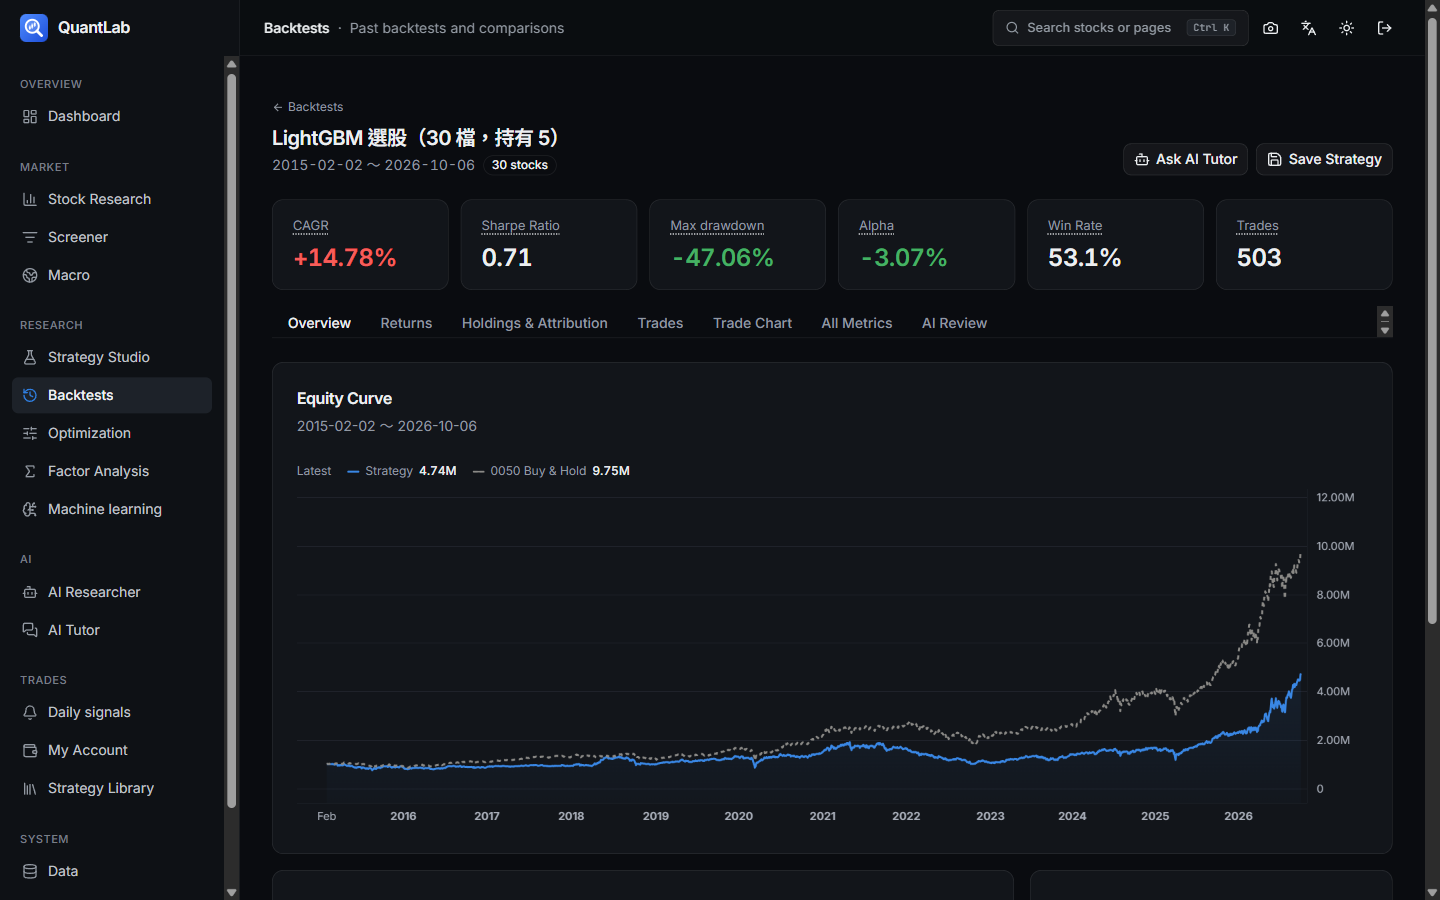
Equity vs 0050, drawdowns, monthly heatmap, rolling Sharpe, trades on the chart, AI review.
Optimisation
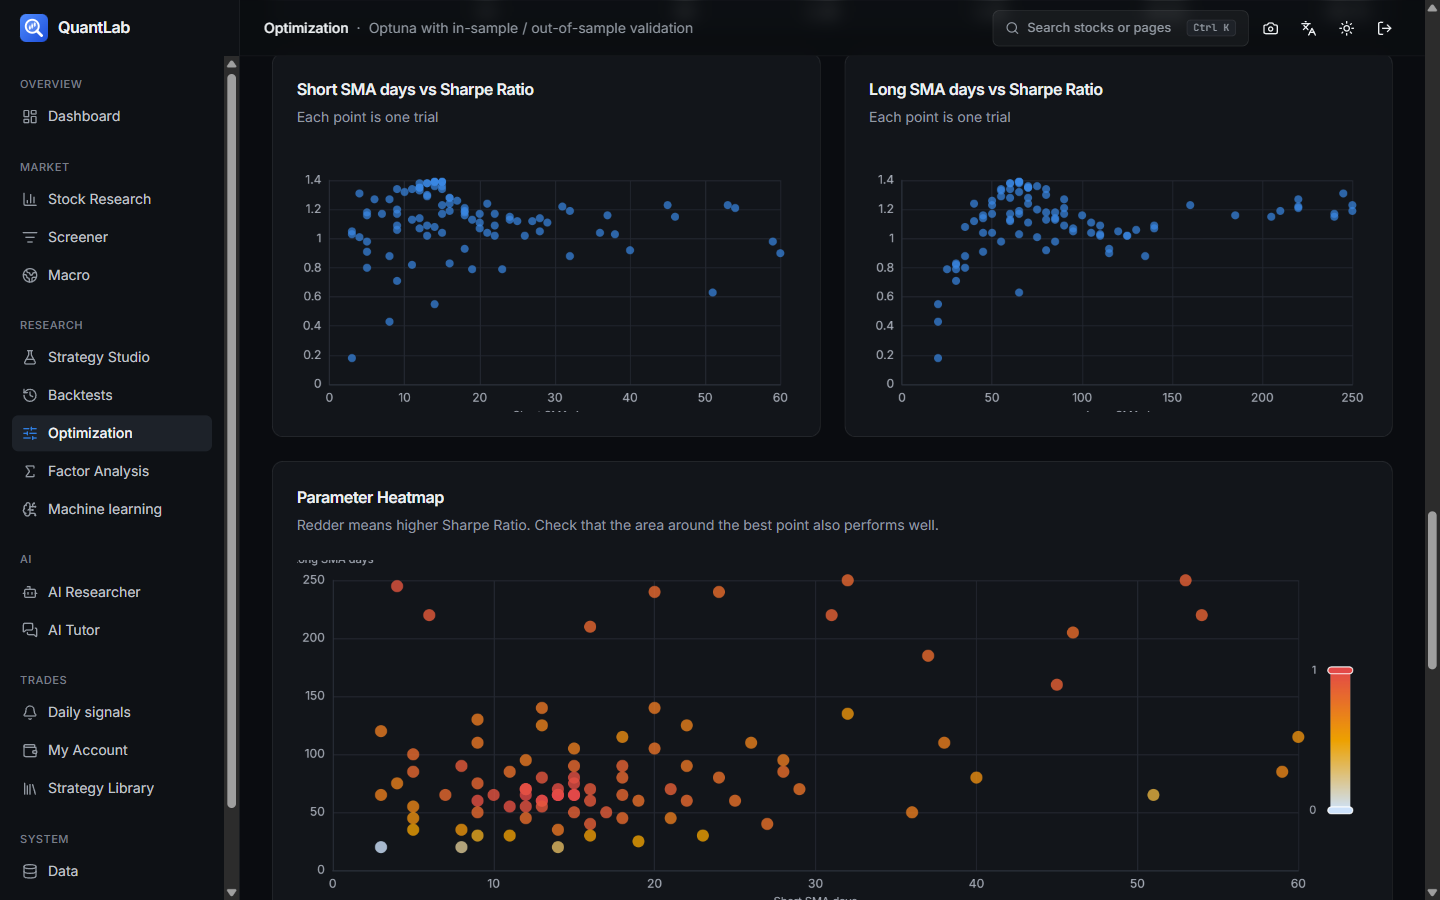
Optuna in-sample search, out-of-sample check, top-10 robustness, Deflated Sharpe.
Factors & ML
IC and quantile returns for 20 factors; walk-forward LightGBM with feature importance.
AI researcher & tutor
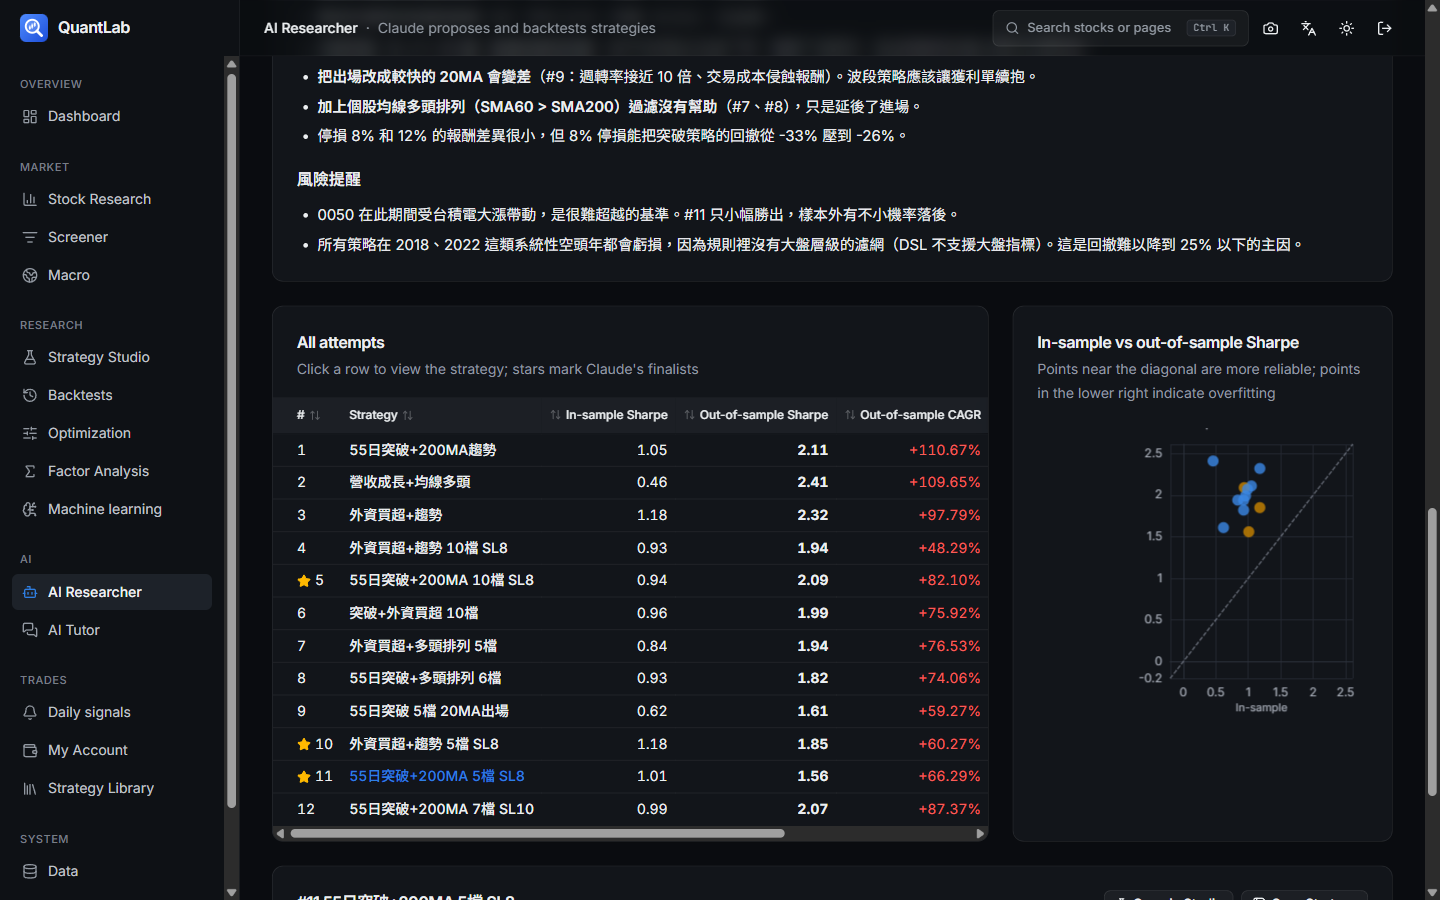
Claude proposes and backtests strategies over several rounds; the tutor queries data, runs backtests and reads screenshots.
Screenshot to AI
Alt-click any card, table or chart and ask Claude about it in the side panel.
Daily signals & account
After the close, an order list sized to each strategy's allocation, round and odd lots separated; real fills recorded.
Live tracking & alerts
Alerts when live results lag the backtest or draw down too far; condition alerts fire only on new matches.
04
Technical details
04.1
No look-ahead: data counts from its publication date
Every data point in a backtest is aligned to the date it actually became available, not the period it describes.
- Monthly revenue uses FinMind's actual publication time, falling back to the 10th of the next month.
- Quarterly reports are usable only from the day after the legal deadline: Q1 5/15, Q2 8/14, Q3 11/14, annual 3/31.
- FRED monthly series are shifted by their publication lag; anything published after today is excluded.
March revenueNot yetQ1 reportNot yetFRED monthlyNot yetBacktest dayJanFebMarAprMayJun- March revenue:10th of next month (fallback)
- Q1 report:Day after the 5/15 deadline
- FRED monthly:Shifted by publication lag
Grey is the period the data describes; until the backtest day passes the badge, the data does not exist.
04.2
Decide at the close, fill at the next open
The engine simulates how Taiwan stocks are actually traded, with Taiwan's real costs.
- Fee 0.1425% × broker discount, 0.1% default slippage, 0.3% sell tax (0.1% for ETFs).
- Only changed weights trade; untradable days defer the order; buys scale down when cash runs short; no margin, no shorting.
- 01Close, day tStrategy sets target weights
- 02Open, day t+1Trade only changed weights
- 03Sell firstFee + tax + slippage
- 04Then buyScaled to available cash
- 05Mark to closeEquity, drawdown, Sharpe
04.3
The AI never sees out-of-sample data
The AI researcher can keep proposing and backtesting, but only in-sample. Its finalists are run out-of-sample by code, and the Deflated Sharpe ratio discounts the luck of trying many times.
- Claude backtests through an internal MCP tool, 12 attempts by default, and submits at most 3 finalists.
- What the AI produces is a JSON-Schema-validated rule set, never code.
In-sample: Claude can see
Attempt 1/12Backtest through an internal MCP tool (lab_backtest)
AI can't crossOut-of-sample: code only
- Finalist 1Waiting
- Finalist 2Waiting
- Finalist 3Waiting
Deflated Sharpe discounts the luck of many tries
Bars are illustrative, not real results.
05
Screens